

Introduction
Companies generate data every day: sales, customers, product performance, financial results, among many others. However, collecting information alone is not enough if it is not transformed into useful knowledge. This is exactly where dashboards come into play: tools capable of turning raw data into strategic insights in a simple and intuitive way.
With dashboards, management becomes more practical and dynamic. They help identify trends, monitor key indicators, and support decisions that can shape the company’s future.
In this article, we will explore what a dashboard is, how it works in practice, and how it can become a powerful ally for entrepreneurs who want to view their business more clearly and strategically.
What is a dashboard?
In simple terms, a dashboard is an interface that allows information to be visualized in an interactive way. Through charts and tables, it becomes much easier to view and understand data when compared to long and hard-to-read spreadsheets.
Another major advantage is accessibility: even people without advanced statistical knowledge can interpret key information in just a few seconds, thanks to the clear and well-organized way results are presented. In addition, dashboards are extremely dynamic: users can filter data by time period, branch, product, and many other combinations, making the analysis more personalized and aligned with each manager’s reality.
Because of their ability to transform numbers into strategic insights, dashboards are a fundamental part of what we call Business Intelligence (BI) — a set of practices and tools designed to support decision-making within organizations.
Why are dashboards important for companies?
Having quick access to strategic information can become a significant competitive advantage. Regardless of company size, the use of dashboards offers several benefits, including:
- Faster and more accurate decision-making: since data can be constantly updated and reflect the business reality in real time, managers gain confidence to act based on evidence rather than assumptions;
- Improved internal communication: all departments — finance, marketing, sales, among others — monitor the same indicators, which facilitates alignment between teams and the definition of shared goals;
- Early identification of problems and opportunities: a sudden drop in sales, for example, can be quickly detected and investigated at an early stage. Likewise, positive trends can be strategically leveraged;
- Clear tracking of goals: beyond showing achieved results, dashboards highlight how much remains to reach targets, functioning as a true control panel for the company;
- Tool customization: each dashboard is built around the most relevant indicators for the business, ensuring analyses that are specific and aligned with organizational needs, rather than generic reports.
In short, dashboards help managers move away from guesswork and make decisions grounded in concrete data, strengthening competitiveness and preparing the company for sustainable growth.
Practical example – The EstatAuto dealership
So far, we have discussed the benefits of dashboards and their implications. To make this perspective more tangible, let’s consider a practical example: EstatAuto, a fictional car dealership that sought Estat Júnior to find solutions for better organizing its data.
Despite achieving a solid sales volume across its three branches, EstatAuto faced challenges common to many companies: difficulty interpreting its own numbers and extracting truly strategic insights for the future. In this context, we developed a customized dashboard for the dealership, bringing together key performance indicators and helping answer crucial management questions, such as:
- Which branch achieved the best performance?
- At what time of year were the most vehicles sold?
- Which brand generated the highest revenue during the period?
- Which type of vehicle yields higher financial returns: new or used?
- What is the dealership’s average customer satisfaction rating?
These and other questions can be answered using the dashboard below:
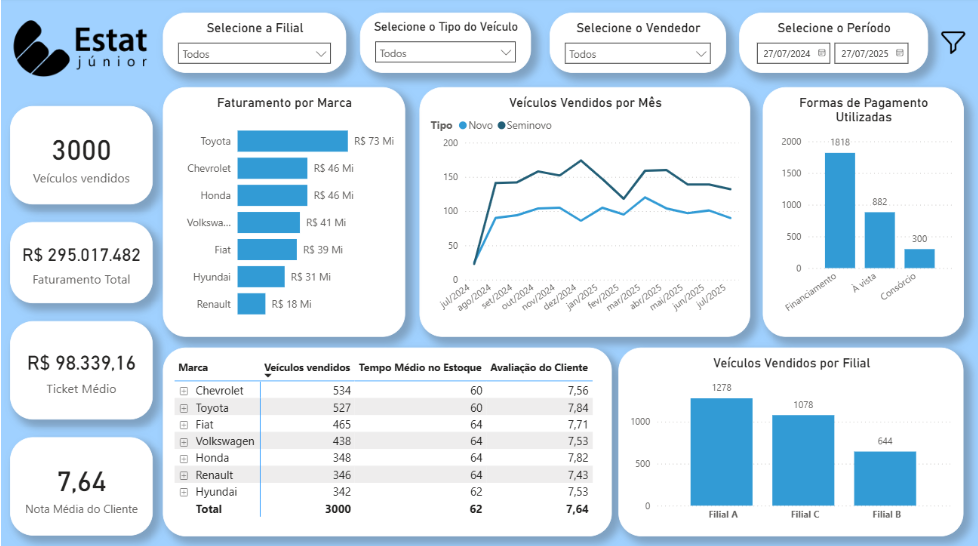
By analyzing the dashboard, we can quickly reach clear and objective conclusions, which are essential for supporting strategic decisions. In this case, we observe that Branch A stood out compared to the others, which may indicate stronger business performance or simply a larger vehicle inventory.
Another interesting insight emerges when crossing indicators: although Toyota recorded the highest revenue in the period, approximately R$73 million, Chevrolet led in sales volume. This contrast suggests that Toyota models have a higher average ticket price, while Chevrolet stands out for offering more affordable vehicles that attract a larger number of customers. For the company, this type of insight can guide decisions ranging from inventory planning to targeted marketing campaigns. It is precisely this ability to transform data into practical analysis that makes dashboards such a powerful tool for business growth.
Moreover, one of the most valuable features of a dashboard is the ability to filter displayed information. In a quick and intuitive way, the entire panel adapts, allowing managers to focus their analysis on specific points of interest, such as a particular branch, time period, or product category. This flexibility makes the tool even more powerful, as it enables a personalized view of the company’s reality.
To illustrate this, let’s look at the same dashboard again, now applying some of the data filters available at the top of the panel. This allows us to see how insights change based on the selected filters.
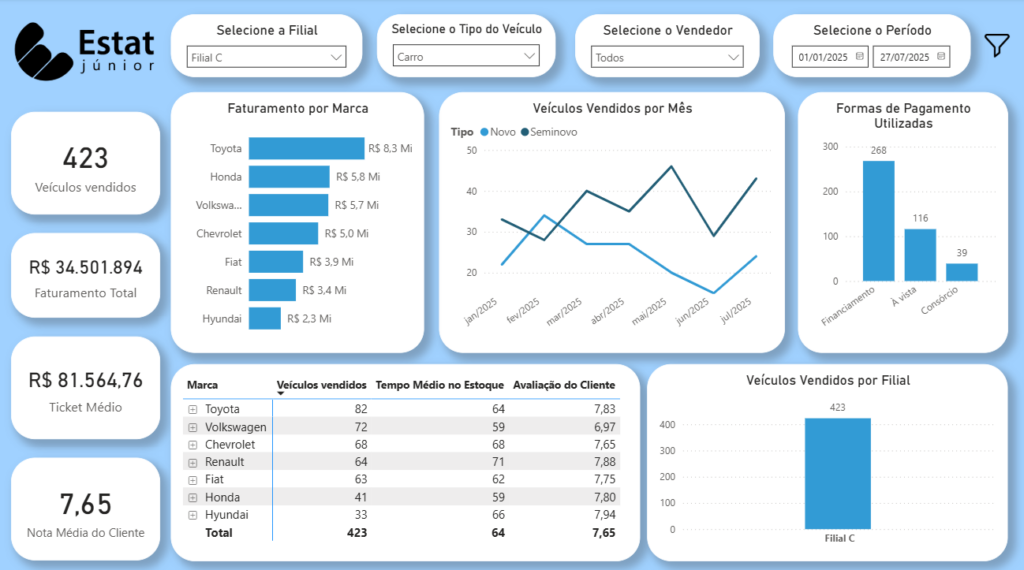
By applying the dashboard filters, we can analyze results in a segmented way, focusing only on vehicles sold by Branch C in the year 2025. This perspective highlights the specific characteristics of this unit and allows for comparison with the company’s overall performance. During this period, Branch C was responsible for 423 vehicles sold, representing approximately 36.8% of the dealership’s total sales (1.148). Another noteworthy point concerns payment methods: while financing accounts for 60.8% of sales across all three branches, in this specific segment it reaches 63.3%, revealing an even greater reliance on this payment option. This ability to explore data according to managerial interest is exactly what makes dashboards such a strategic tool for turning information into competitive advantage.
Conclusion
In summary, dashboards represent far more than well-organized charts and numbers: they are tools that bring managers closer to their business reality, offering clarity, speed, and confidence in decision-making. By enabling personalized analyses, scenario comparisons, and opportunity identification, dashboards establish themselves as true strategic allies for companies of all sizes.
As seen in the EstatAuto example, information that was once scattered is transformed into concrete insights capable of guiding actions and opening paths to new results. More than simply monitoring indicators, dashboards allow businesses to envision the future with greater confidence and strategic vision.
If your company also aims to turn data into meaningful knowledge and make more informed decisions, dashboards can be the first step toward making this process a reality. And you, have you ever thought about what a dashboard could reveal about your company’s future? Get in touch with Estat Júnior and discover how we can help your business transform data into results.
And if you’re curious to explore different filter combinations beyond those discussed in this article, access the link below and create your own analysis:https://app.powerbi.com/view?r=eyJrIjoiMGVlOGZjNzctOTgzMy00YTJiLTkyYzItNzk5ZjIxNDFjYTEzIiwidCI6ImI0NzQxYTgyLTZiNmUtNDNhNS1hZDZlLTEwNDQ1MTFhYWVkNiJ9
Author: João Victor Lima Moraes
1 comentário em “Dashboards: How to Turn Data into Stategic Decisions”
João Victor, congratulations on an excellent and insightful article!
Your explanation of how dashboards transform raw data into strategic decision‑making tools is not only clear and engaging, but also incredibly relevant for complex operational areas such as International Logistics.
In our field—where visibility, timing, and precision are critical—your article brilliantly highlights how dashboards can unlock powerful capabilities: real‑time tracking across global flows, early detection of bottlenecks, faster financial reconciliation, performance monitoring of carriers and ports, and smarter planning aligned with business targets.
You managed to show, in a very accessible way, how data visualization becomes a true competitive advantage. Your work inspires teams to think more strategically about information and reinforces how Business Intelligence can elevate logistics operations to a new level of efficiency and reliability.