

A time series is simply a sequence of data points ordered in time. In a time series, time is often the independent variable, and the goal is typically to make a forecast for the future. This is in contrast to cross-sectional data, which is a sample of data used in statistics and econometrics, representing individuals, consumers, companies, cities, etc., at a given point in time.
Although some data, in certain situations, may not precisely correspond to the same period, in a cross-sectional analysis, such time differences that are not of great significance are ignored.
Since data points in time series are collected at adjacent periods, there is potential for correlation between the observations. This is one of the features that distinguishes time series data from cross-sectional data.
Time series data can be found in economics, social sciences, finance, epidemiology, and physics.
| Field | Example Topics |
| Economics | Gross Domestic Product (GDP), Consumer Price Index (CPI), S&P 500 Index, and unemployment rates |
| Social Sciences | Birth rates, population, migration data, political indicators |
| Epidemiology | Disease rates, mortality rates, mosquito populations |
| Medicine | Blood pressure control, weight management, cholesterol measurements, heart rate monitoring |
| Physics | Global temperatures, monthly observations of sunspots, pollution levels. |
The statistical characteristics of time series data often violate the assumptions of conventional statistical methods. Because of this, the analysis of time series data requires a unique set of tools and methods, collectively known as time series analysis.
What are time series data?
Time series data is a collection of quantities gathered at regular time intervals and arranged chronologically. The time interval at which the data is collected is usually referred to as the frequency of the time series.
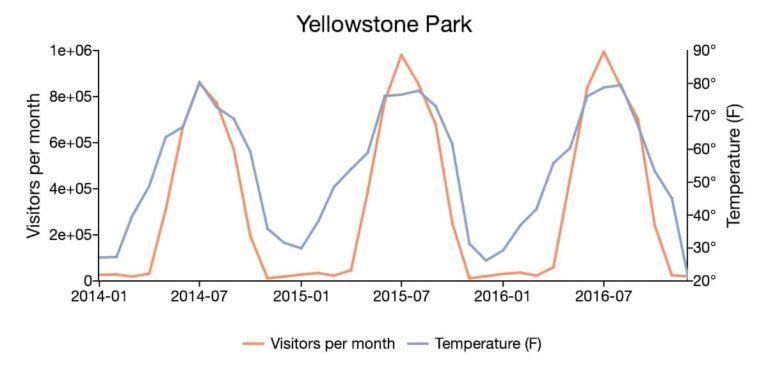
For example, the time series plot above shows the monthly visitors to Yellowstone National Park along with the monthly average temperatures. The data ranges from January 2014 to December 2016 and is collected at a monthly frequency.
What is a time series plot?
A time series plot represents the observed values on the y-axis in relation to a time increment on the x-axis. These plots visually highlight the behavior and patterns of the data and can establish the foundation for building a reliable model.
More specifically, visualizing time series data provides a preliminary tool to detect if the data:
- Reverts to the mean or exhibits explosive behavior
- Has a time trend
- Displays seasonality
- Demonstrates structural breaks
This can help guide the testing, diagnosing, and estimation methods used during time series modeling and analysis.
Mean Reverting Data

Mean Reverting Data is the theory that suggests that prices or other economic indicators tend to move towards the mean or historical average over time.
It is important to know if a model includes a non-zero mean because it is a prerequisite for determining appropriate testing and modeling methods.
For example, unit root tests employ different regressions, statistics, and distributions when a non-zero constant is included in the model.
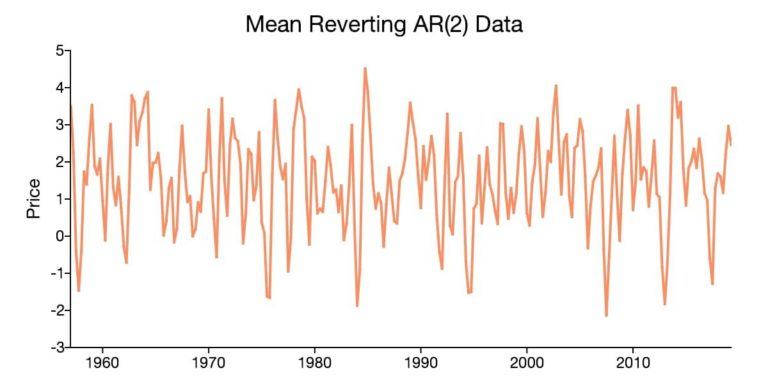
A time series plot provides a tool to visually inspect whether the data exhibits mean reversion, and if it does, it signifies that the data is centered. While visual inspection should never replace statistical estimation, it can help you decide if a non-zero mean should be included in the model.
For example, the data in the above figure varies around a mean that is above the zero line. This indicates that models and tests for this data should incorporate a non-zero mean.
Time Trending Data.
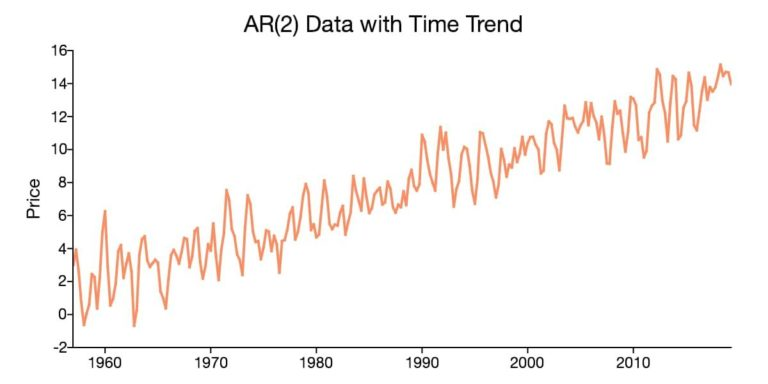
In addition to having a non-zero mean, time series data can also exhibit a deterministic component that is proportional to the period. When this occurs, the time series data displays a time trend.
Time trends in time series data also have implications for testing and modeling. The reliability of a time series model depends on the proper identification and accounting of time trends.
A time series plot that appears to be centered around an increasing or decreasing line, as in the above chart, suggests the presence of a time trend.
Seasonality

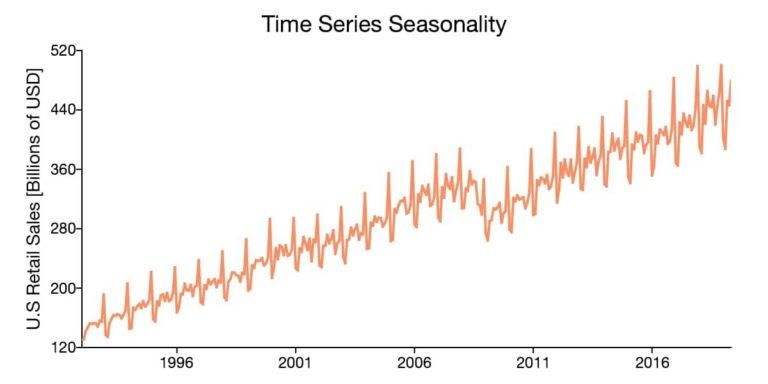
Seasonality is another characteristic of time series data that can be visually identified in time series plots. Seasonality occurs when the time series data exhibits regular and predictable patterns at intervals shorter than a year.
An example of a time series with seasonality is retail sales, which often increase between September and December and decrease between January and February.
Structural Break
Sometimes, time series data exhibits a sudden change in behavior at a specific point in time. For example, many macroeconomic indicators experienced a drastic change in 2008 following the onset of the global financial crisis. These sudden changes are often referred to as structural breaks or nonlinearities.
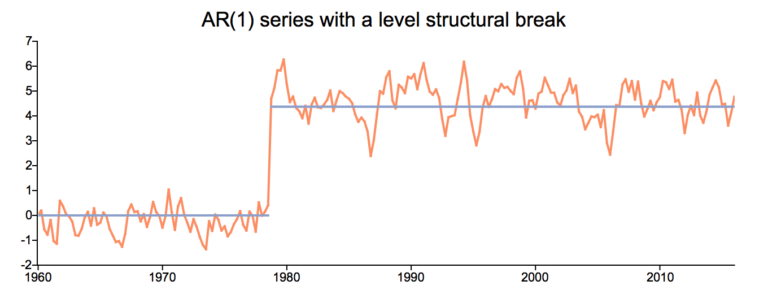
These structural breaks can create instability in the parameters of a model, which can diminish its validity and reliability.
While statistical methods and tests should be used to test for structural breaks, time series plots can aid in the preliminary identification of structural breaks in the data.
Structural breaks in the mean of a time series will appear on the plots as sudden changes in the level of the data at certain breakpoints. For example, in the above time series plot, there is a clear jump in the data’s mean around the early 1980s.
Did you enjoy our article on Time Series? Comment and share the article to continue bringing informative and quality content to you.
This article was provided by our partner ICMC Júnior, a junior enterprise of Mathematical and Computer Sciences at USP – São Carlos Campus. Check out the original text here and here.
Liked the article? Don’t forget to visit their blog, share with friends, and follow them on social media. See you next time!
If you want to request data analysis or other services, please contact our team!
The text has been translated by Rubens Cortelazzi Roncato